


This is an honest review and not a paid promotion.

I found the book on Christmas suggestions list and as happens when you’re looking for presents for other people, I added this one to my list and Santa (my sister) was kind enough to send it over.
This book is not one to read and put back on the shelf but more like one to keep close for inspiration and ideas.
What I find fascinating about data viz is that it is inherently human. One needs to account for the audience, their needs, their level of understanding of the data, their motivations and even how they see or perceive colours. Failing to do so detracts from the value of our own analysis work on the number crunching side.
This book takes you through actual examples (good and bad) from a variety of scenarios across multiple industries. Counterintuitively, I loved the bad examples, maybe because of how they were marked:

If even cats get a panic attack when they see your viz, then something is truly wrong. In all seriousness, the bad examples weren’t necessarily bad, just not particularly good at conveying the value of the underlying data in that particular scenario.
Throughout the examples you’ll see time and time again: “How are people going to use this dashboard?”. While this question has long been associated with UX, I think it’s fantastic to have a book on data visualization with real-world examples that accounts for how data is consumed and by whom.
🔸 How is the learning structured and what should someone expect?
The book first introduces the reader to the fundamentals of data analytics and then the largest part of it has those real life examples we all look for when we’re stuck. The examples cover a large variety of scenarios I absolutely loved. As I went through them I discovered my own errors or scenarios I would have approached differently.
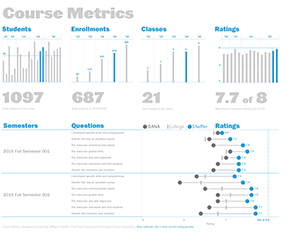
For example, I am really not a fan of dot plots and I definitely avoid them for the most part. It’s like I have my own scaredy-cat in my head and it activates with each dotted plot. But in the book's examples on sentiment analysis, I discovered the dot plots + histograms are really really cool!
Another fantastic help for this middle part is how the chapters are structured for each scenario:
- Big Picture, Specifics and Related Scenarios
- How people use the dashboard
- Why this works
- Author commentary
The third and last part of the book has tips on how to successfully present your dashboards in the real world.
🔸 What were my main takeaways?
Data viz is as much about business knowledge and people as it is about data. The same data can and should be visualized differently depending on your audience. One of the most valuable takeaways for me: choosing a simple visualization isn’t about choosing the most basic line chart but about selecting the visualization option and the accompanying notes that will help the reader understand your data correctly in the shortest amount of time.
🔸 Is there something I'd change?
Make more of it :) For all of those who feel the same there is Chart Chat – all of the episodes are on Youtube too. Personally I love the format of it because they openly discuss different options and scenarios and they have fantastic guests as well.
🔸 Who would I recommend it to and why?
Anyone primarily involved in creating data viz. I wouldn’t say it’s the best first introduction for a newbie because there’s a lot to take in. But it really is a book to keep close for inspiration. My copy spends a lot of time on my desk.

